Good afternoon, inkheads! It’s time for another fun-filled episode of the 21/20 Marketing broadcast on Google Plus with my esteemed colleagues Richard Dannenberg and Spencer Powell. We’ll be on the plus side tomorrow, Thursday, May 29th at 4pm EST/1pm PST. Be sure to RSVP on the official event page on Google Plus:

Click me to visit the Google Plus Event Page
KPIs for Printing and Mailing Companies
Tomorrow’s topic suggestion comes to us from the lovely Kate Gansneder, the marketing mastermind behind Washington Graphics. Kate wanted to discuss KPIs (Key Performance Indicators), to help you figure out what to measure and how to create an actionable plan to improve your metrics. Kate’s very well versed in this subject, and she should probably be taking my place in tomorrow’s Hangout. Fortunately, our resident Southern Gentleman Richard happens to be very familiar with KPIs, so I’ll let him do most of the talking. We will cover this stuff and more:
- Why do I need to measure anything?
- Are business measures and marketing measurements the same? Why or why not?
- What tools do I need to measure marketing KPIs?
Google Analytics and Goal setting for meaningful marketing data
While I’m a bit out of my comfort zone as far as KPIs are concerned, I’m confident that I at least know more about Google Analytics than Richard. For my part in tomorrow’s Hangout, I’ll show you how to work Analytics like a pro. This would be especially important for printers with a Web to Print solution in place because goal setting works best for ecommerce sites. If you aren’t equipped to take orders online, don’t worry; Analytics will still provide valuable data to improve your results.
Goals in Analytics are important because they let you know how often users take specific actions on your website, such as place an order or fill out a request form for free printing samples. You’ll learn how to set up goals to track campaigns and use funnels to pinpoint where users get stuck on your website.
I’ll go into more details as far as goals during the #2120Marketing Hangout, but for now let’s talk about your priorities in Google Analytics. The amount of data available feels overwhelming at first, and it’s tough to figure out where to start. The fact that the Analytics interface changes frequently doesn’t help matters. Here’s what you need to zero in on while you get comfortable with the program.
Acquisition > Channels
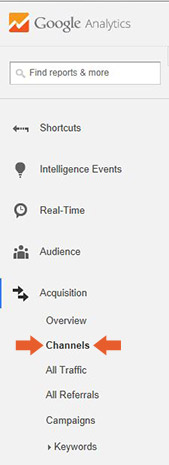
The acquisition section shows you how people found your website i.e. through search engines, direct or type-in traffic, referrals from other sites, or referrals from your social media communities. You’ll find the segmented traffic breakdowns listed under channels along with other useful info, such as the average bounce rate from a particular medium.
Behavior > Site Content > Landing Pages
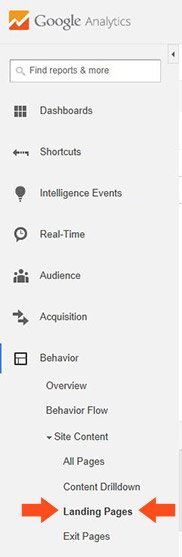
In this case, the term landing page doesn’t fit the usual definition. These aren’t special pages you’ve built for a PPC campaign or to track leads from a printed catalog. Landing pages in this sense refers to the exact URLs where users land on your website. This data shows you which pages are getting the most visits and identifies possible problem areas. You’ll be able to see where there’s room for improvement based on the bounce rates. In general, when you see higher bounces (50% or over) that usually means there’s an issue with the content on a page or with its load speed.
Behavior> Site Speed > Page Timings
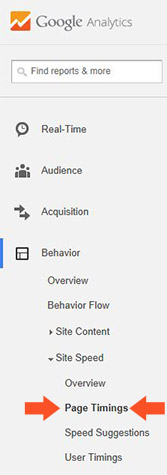
Speaking of load speeds, users HATE slow websites. In fact, making your site faster will improve conversions (sales) almost automatically. Plus search engines favor fast sites, so you’ll get a boost in your organic traffic, too. If your pages are taking more than 3 seconds to load, read the speed suggestions in the same section for ways to improve.
Ecommerce > Product Performance > Secondary Dimension > Source/Medium
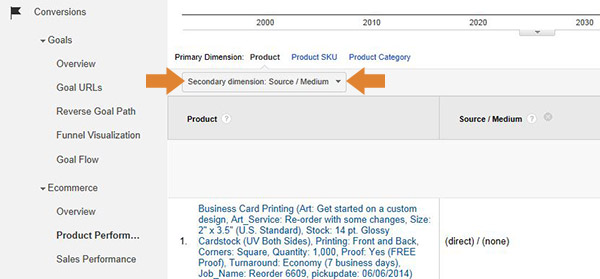
You’ve probably already figured out that you need to monitor transactions/purchases on your site. That’s kind of a no-brainer, yet newbies often fail to properly attribute the source of the sales on an item by item basis. There are other ways to find this data in Analytics, but I find this method to be the least confusing. Sorting out the sources of your conversions allows you to see exactly what products are popular with new customers (usually the people who visit through search engines) and which appeal to the loyal clients (the users who visit your site directly).
Recommended KPI reading from Richard Dannenberg
Enough about Analytics for now—let’s get back to KPIs for your printing business. Prepare for tomorrow’s live Google Plus broadcast by catching up on Richard’s excellent and entertaining article series on his blog:
Tape Measures and Marketing Measures Part 1– in which we learn about measurements and other fancy stuff, such as correlative vs conjectural data.
Tape Measures and Marketing Measures Part 2– in which we learn the difference between business KPIs and marketing KPIs.
See you tomorrow on Google Plus! Be sure to tweet your questions live with the hashtag #2120Marketing.